Make Smarter Financial Decisions at the End of the School Year with Dashboards
Share in
In this blog, we explain how dashboards —also known as control panels— enable school leaders and administrators to access real-time information and improve financial decision-making at the end of the academic year.
The Financial Challenge of Closing the School Year
Authors such as Alpízar, M. and Lauchy, S. define financial management as "a set of interrelated actions and processes aimed at ensuring the organization, in an efficient and effective manner, has the financial and material support necessary for its operation, while strictly controlling resources and using them rationally."
Closing out the academic year is one of the most critical moments in the administration of an educational institution. It’s not just about finalizing grades or planning for the upcoming term—it also involves making financial decisions that ensure the school’s stability and future growth.
In many Latin American educational institutions, there is a lack of well-defined performance indicators that could support the evaluation of key administrative processes—whether strategic, operational, or support-related. As a result, it becomes difficult to measure progress, leading to delays in data flow, increased costs, and a longer decision-making cycle.

What Is a School Dashboard?
School dashboards offer real-time data visualization, enabling faster and more informed decision-making across the orgaization.
In both Latin America and Mexico, dashboards have become increasingly essential in the educational and financial sectors. In schools, dashboards provide insights into everything from financial data to academic and administrative indicators.
Dashboards are also used to track public spending. For instance, in 2023, higher education ranked as the second-largest area of educational expenditure in Mexico. From a financial standpoint, dashboards are vital tools for monitoring Key Performance Indicators (KPIs) within educational institutions.
A McKinsey study found that using visual tools like dashboards increases data comprehension by 70%, facilitating more collaborative decision-making.
A robust school dashboard should include:
Real-time income and expense reports
Tuition payment tracking
Late payment rates by class or grade level
Monthly and annual comparisons
Financial efficiency indicators
Visually, a dashboard allows administrators to see the “big picture” of the school’s financial health—without having to dig through multiple spreadsheets or scattered reports.

A Financial Decision You Could Make:
According to the Statista Consumer Insights macro survey, an average of 38% of respondents in six Latin American countries envision conducting all their financial transactions entirely online.
Don’t get left behind, implement online payments today.
How to Implement Dashboards in Your School
a) Define your key indicators
Before building a dashboard, identify what you need to measure— late payment rates, revenue by grade level, overdue payments, category-based spending, etc.
b) Use school platforms that already include dashboards
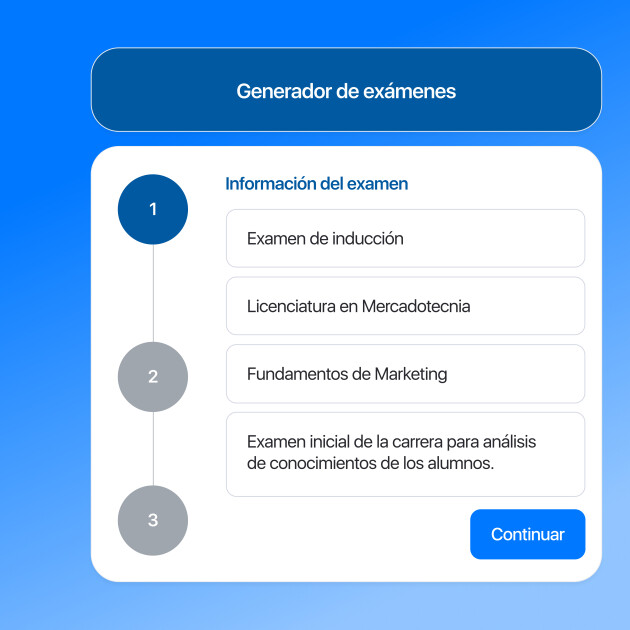
Solutions like Academic Analytics come with customizable financial dashboards out of the box.
c) Automate data entry
Use systems that automatically capture information from online payments, student registrations, or accounting reports.
d) Train your team
Dashboards aren’t just for the accountant—train your principal, academic coordinators, and administrative staff to make informed decisions based on the data.
The Future of School Administration Is Strategic
Education doesn’t rely on pedagogy alone—it also demands intelligent management. Dashboards make this possible by shifting from reactive management to data-driven decision-making.
End-of-year financial decisions are an opportunity to plan ahead, course-correct, and drive growth.


Ready to Transform Your School’s Financial Management?